Case study · Computer vision
Reading the game: live win probability from broadcast video alone.
Independent R&D, February 2025. No API, no game data feed: just the pixels a viewer sees. The pipeline detects players on the minimap, reads the score and clock from the HUD, and predicts the winner every second of the match.
Source footage is publicly broadcast Call of Duty League match video used for research. Team names and logos visible in screenshots belong to their owners.
99.3%
frame coverage after post-processing
28% → 97%
hold-out accuracy, raw vs. cleaned data
111,360
frames processed
~90%
labeling time saved with model-assisted annotation
Demo clip
Fifteen-second excerpt of the rendered overlay. The bar at the bottom is the model's live estimate; the score and clock it reads are in the HUD at the top.
The problem
Real-time win probability with no data feed
Traditional sports broadcasts show a win-probability graphic driven by official play-by-play data. Esports broadcasts have no equivalent feed available to a third party. Everything the model needs, the score, the clock, and who controls the map, is only visible as pixels on screen.
The goal was a system that ingests standard 1080p/60fps broadcast video of Call of Duty Hardpoint matches and outputs a calibrated probability, every second, of each team winning. It had to be reliable enough that the overlay never shows an impossible state.
The pipeline
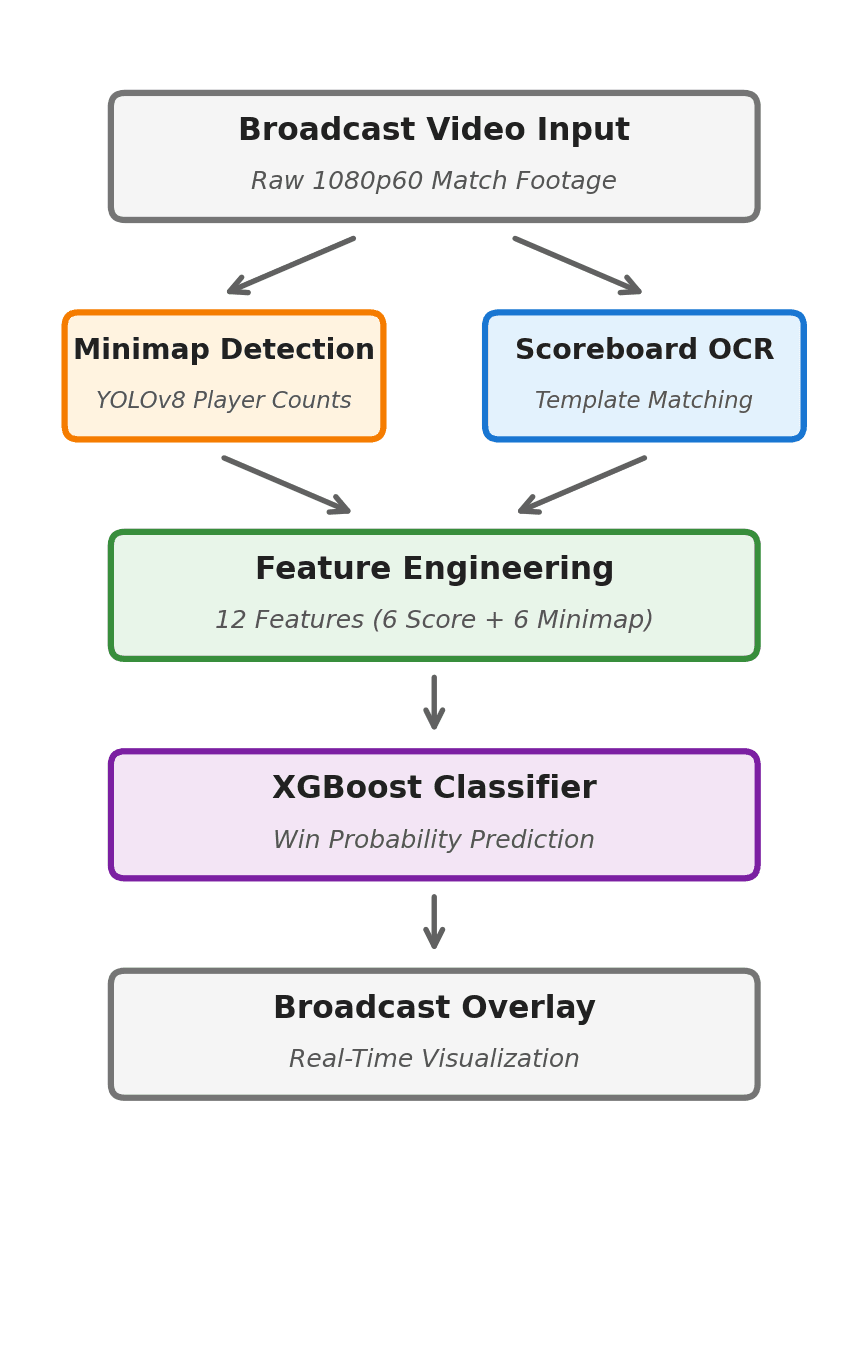
Four stages, video in, probability out
Data acquisition and labeling
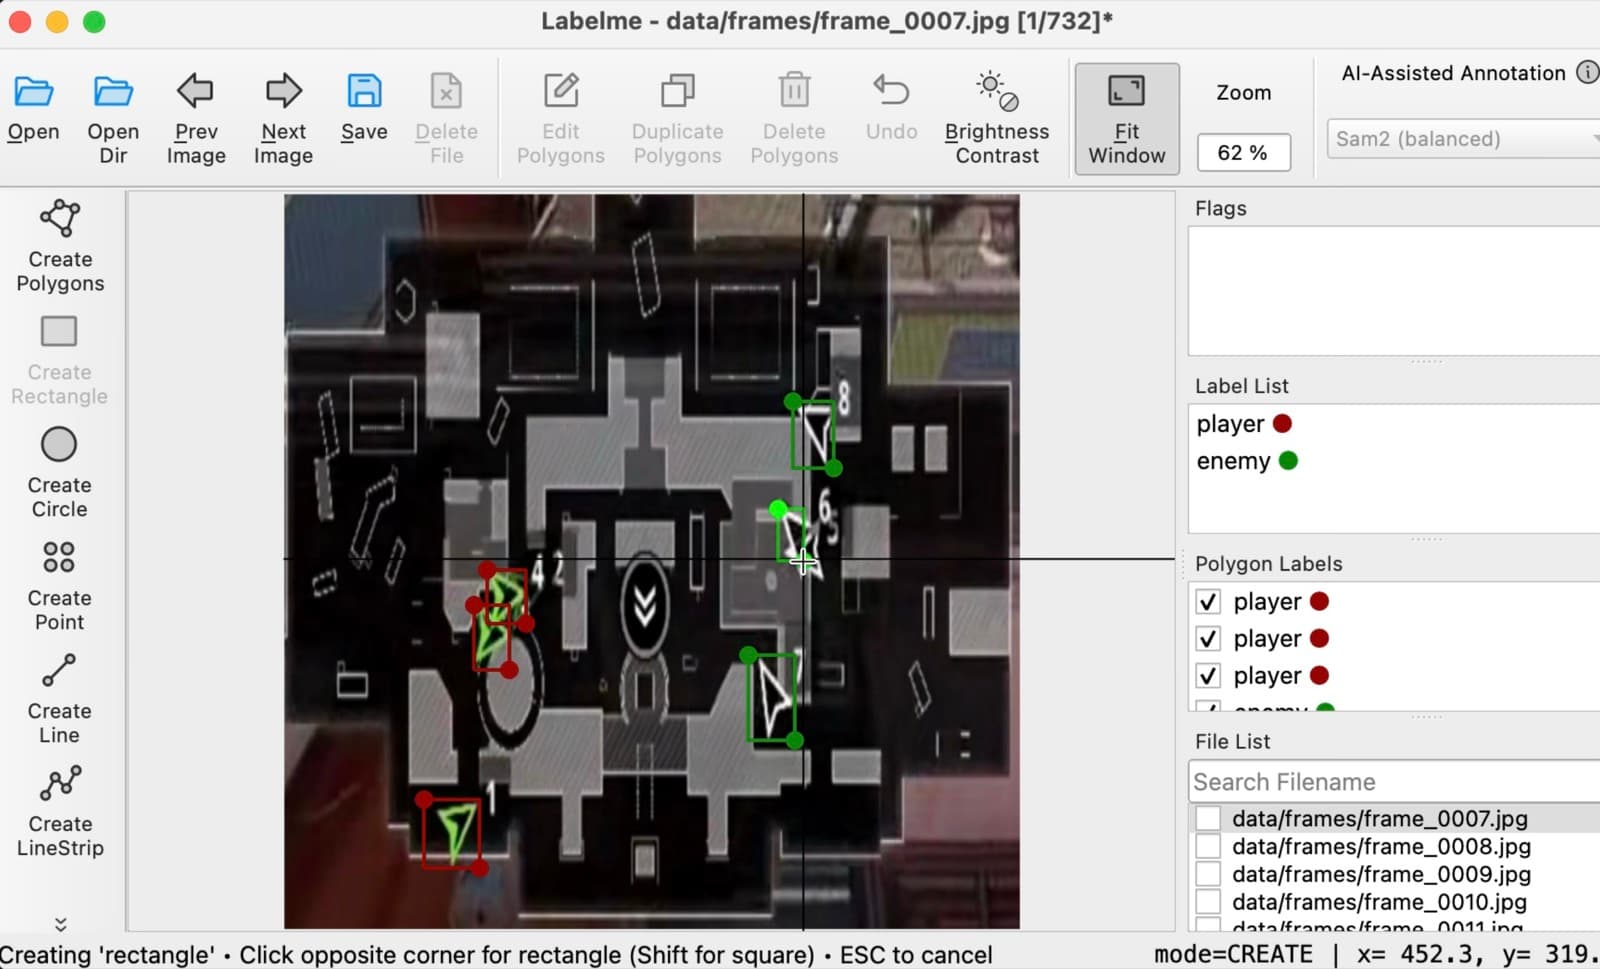
Frames sampled every five seconds from 1080p/60fps match video, cropped to the fixed minimap region. Fifty frames were labeled by hand in LabelMe; a small YOLOv8-Nano model trained on those fifty auto-labeled the remaining ~1,450 for human correction, cutting annotation time by roughly 90%.
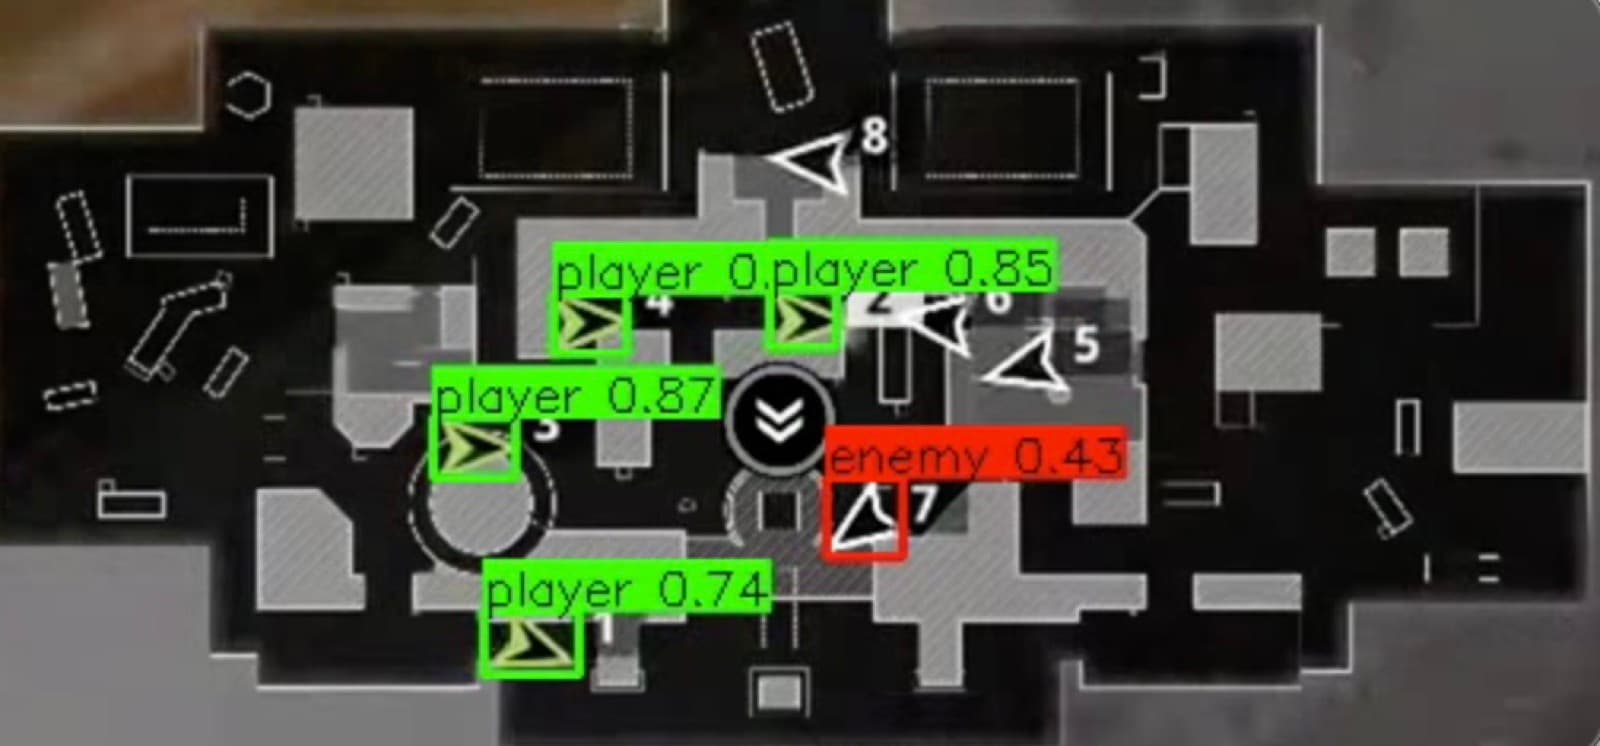
Minimap detection (YOLOv8-Medium)
A YOLOv8-Medium detector trained for 100 epochs on Apple Silicon (MPS) finds friendly and enemy markers on the minimap. Counting detections above a 0.25 confidence threshold gives map-control telemetry the scoreboard cannot provide.
Scoreboard and clock OCR (template matching)
Scores (0–250) and the game clock are read from fixed HUD regions with OpenCV normalized cross-correlation against digit templates extracted from the video itself. Instead of reading arbitrary digit strings, the system enumerates every valid score and picks the best-fitting one, which rules out impossible readings by construction.
Win-probability model (XGBoost)
Twelve engineered features (six scoreboard, six minimap, including 30-second rolling map-control averages) feed an XGBoost classifier. Mirror augmentation swaps team perspectives to double the training rows and balance classes. Output is smoothed with a 45-second rolling average and rendered as a broadcast overlay at 59.94 fps.
What was hard
Where the time actually went
Neural OCR hallucinated plausible-looking numbers
The first pass used EasyOCR. It read "250" as "2S0", produced scores of 839 in a game capped at 250, and let scores go backwards. The errors looked fine at a glance and quietly corrupted the training data. Replacing it with template matching plus score enumeration removed impossible readings entirely.
Anti-aliasing made identical digits match differently
Sub-pixel anti-aliasing varies frame to frame, so a template cropped from one frame scored poorly on the same digit elsewhere. The fix was mundane: up to ten template variants per digit, extracted at native resolution from frames with a known score, and matching on the whole region rather than segmenting tightly kerned digits first.
The model was fine; the data was not
Raw extraction read 71% of score frames and 42% of clock frames. Outlier removal, monotonicity enforcement (Hardpoint scores only go up) and forward-fill brought coverage to 99.3%. A row-level audit then threw out 18 of 21 candidate match files for impossible score jumps or a 250–250 final. Hold-out accuracy went from 28.2% on the raw data to 97.2% on the cleaned data with the same model.
Results
99.3% coverage, 97% hold-out accuracy
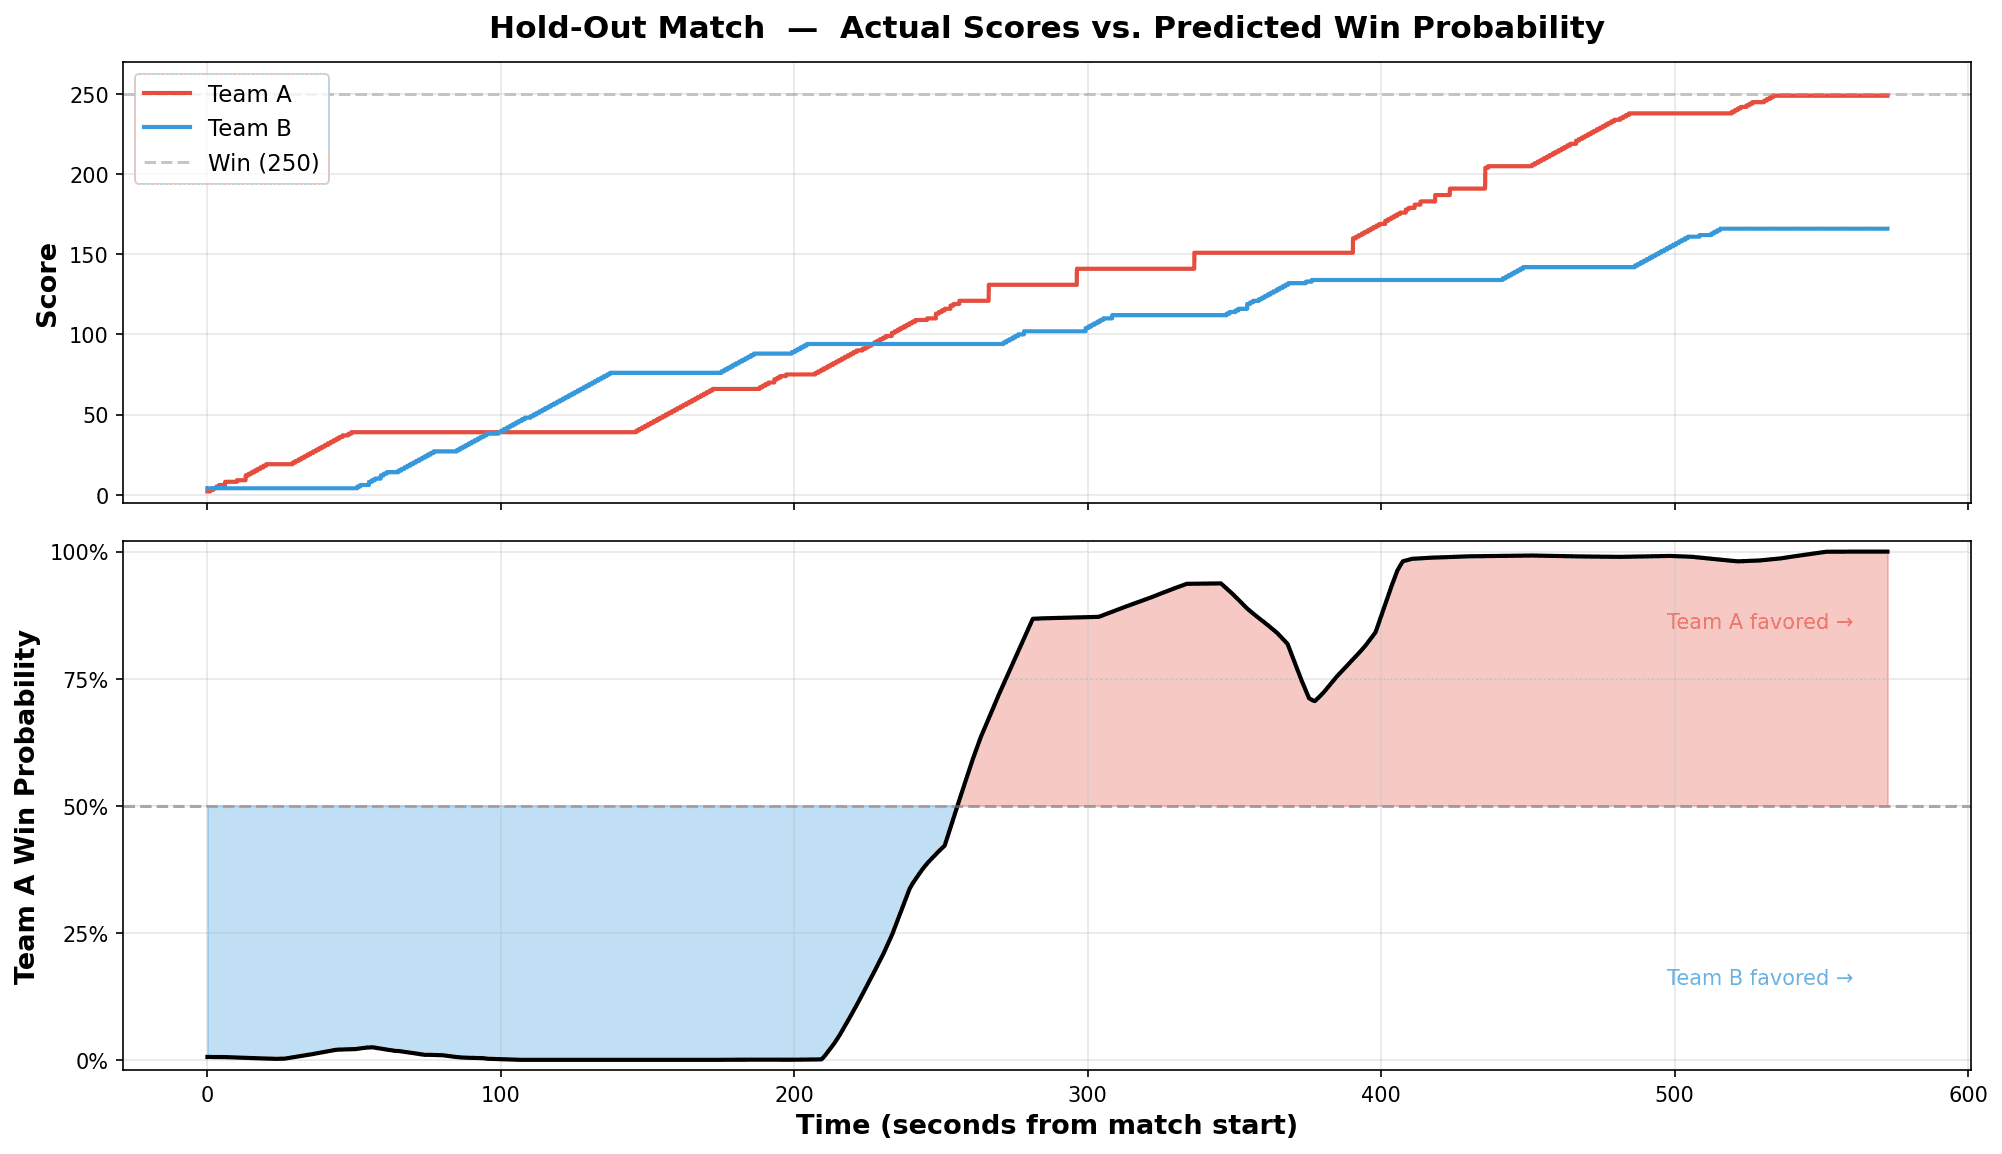
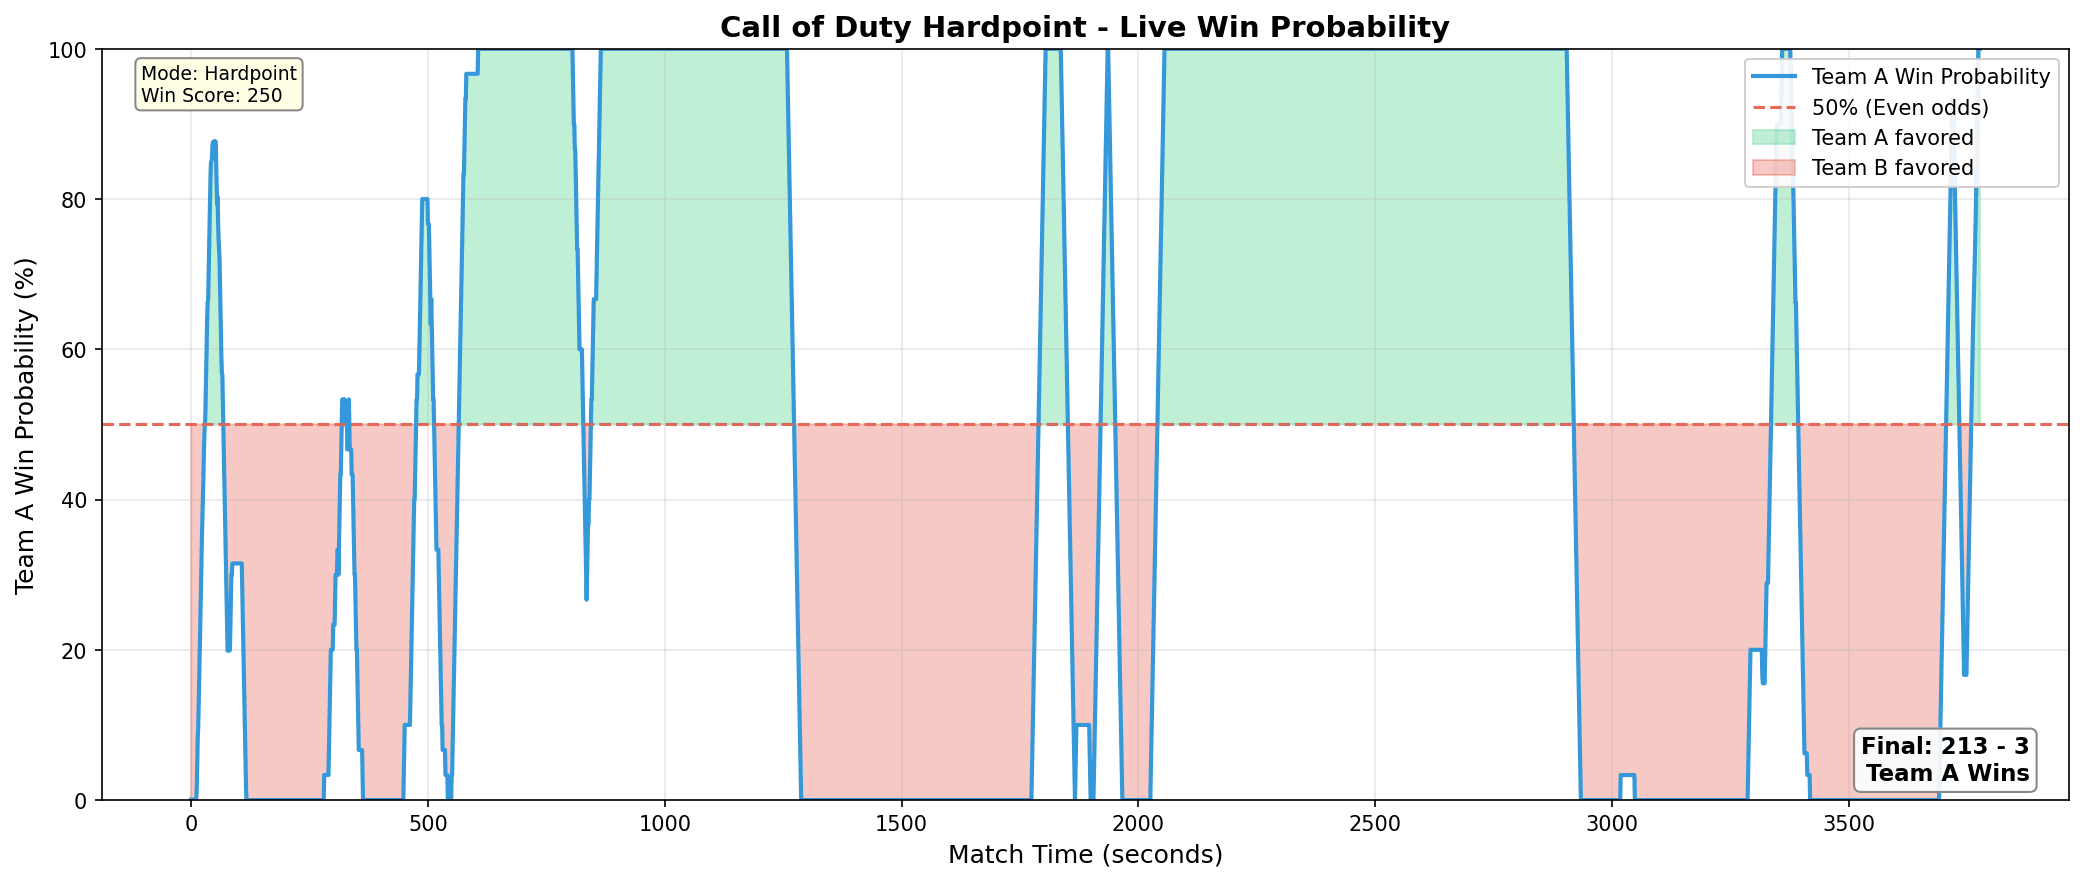
Validation used a hold-out match the model had never seen. The top panel is the actual score of both teams; the bottom panel is the model's probability that Team A wins, computed only from what it read off the screen. The probability crosses 50% about forty seconds before Team A takes the lead on the scoreboard, because the minimap features see map control shift before it turns into points.
Top features by importance
- 0.26 score_diff
- 0.16 player_alive_rolling
- 0.15 enemy_alive_rolling
- 0.13 advantage_rolling
Roughly 43% of predictive power came from minimap telemetry, information that does not exist anywhere in the scoreboard.
Known limits
Three clean matches in the training set; some residual 5/6 and 0/8 digit confusion masked by smoothing; templates and regions calibrated for one broadcast layout. All documented in the validation report.
What transfers to agency work
The same methods, less glamorous video
A game broadcast is a convenient stand-in for any camera pointed at something that reports its state visually. The pieces that mattered, fixed-region reading, small-object counting, temporal smoothing and a validation gate, are the pieces agency problems need.
Gauge and panel reading where no data bus exists
Legacy analog gauges, seven-segment displays, control panels and HUDs can be read from a camera the same way the scoreboard was: fixed regions, template matching for stylized fonts, and validation rules that reject physically impossible values.
Counting from fixed or drone video
The minimap detector is a small-object counting problem. The same approach applies to vehicles in a lot, people at an entrance, animals in a survey transect or equipment in a yard, with rolling averages to smooth frame-level noise.
Telemetry extraction from recorded video
Archived inspection, range or training footage becomes a timestamped table of readings, counts and positions that analysts can query, chart and join to other records.
Document and form OCR with validation rules
The lesson that OCR output needs domain constraints (caps, monotonicity, allowed values) carries directly to digitizing forms and legacy records where a confident wrong read is worse than a blank.
Tech stack
Tools used
- Python 3.12
- Pipeline language
- PyTorch + MPS
- Training and inference on Apple Silicon
- Ultralytics YOLOv8
- Nano for labeling assistance, Medium for production
- OpenCV
- Video I/O, thresholding, template matching (TM_CCOEFF_NORMED)
- XGBoost
- Win-probability classifier
- scikit-learn
- Accuracy, AUC-ROC, hold-out evaluation
- pandas
- Telemetry cleaning and feature engineering
- LabelMe
- Bounding-box annotation
- yt-dlp
- Source video acquisition
- matplotlib
- Validation charts and overlay rendering
Have video you need numbers from?
Send a sample clip and a sentence about what you need to count or read. We will tell you honestly whether it is a two-week job or a research project.